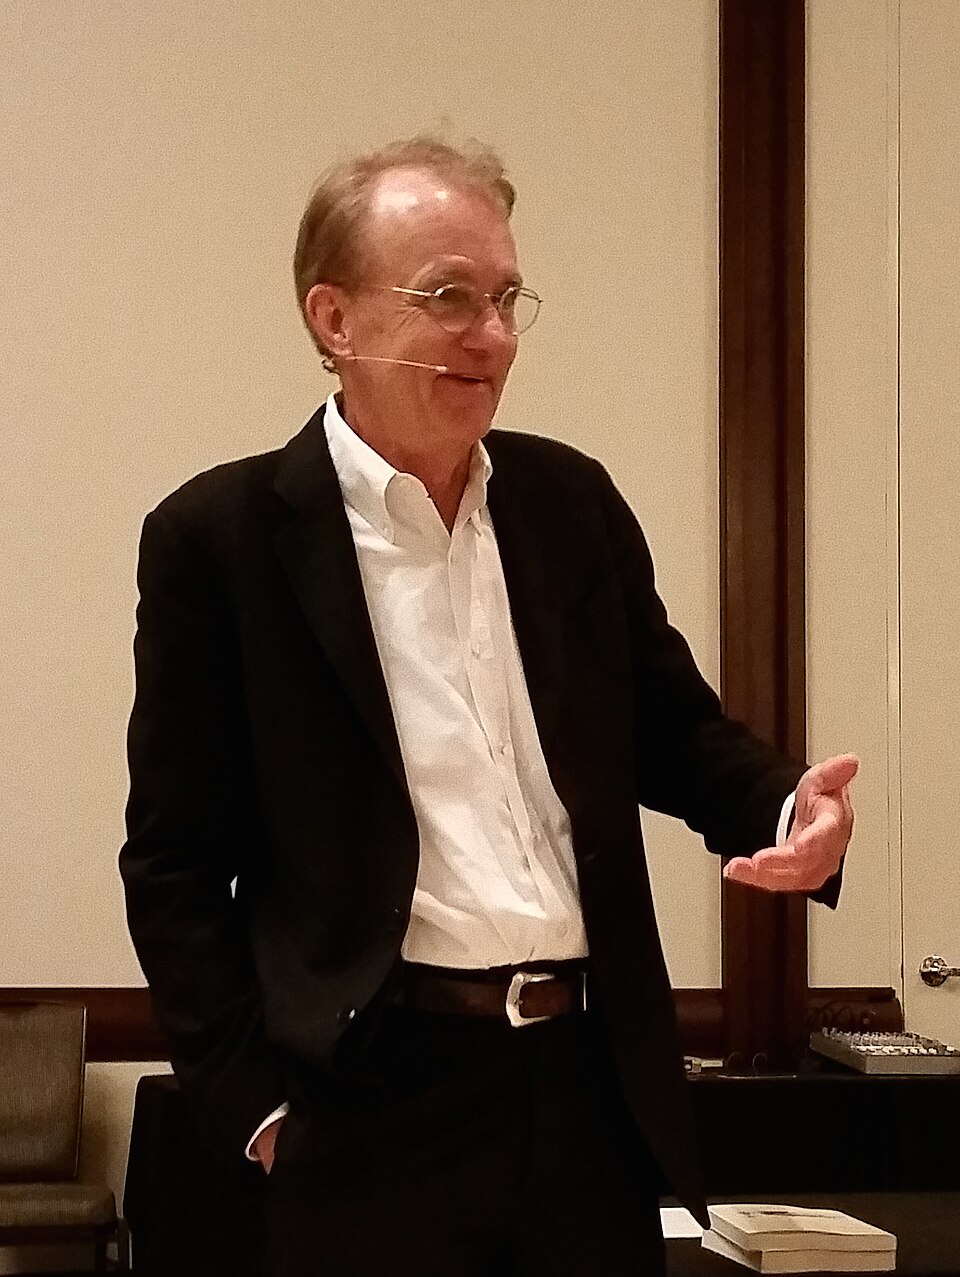
b. 1942, Kansas City, USA · Political scientist and statistician; pioneer of information design
Also known as: Edward R. Tufte, E. R. Tufte
Edward Rolf Tufte trained as a political scientist and statistician at Stanford and Yale, where he taught for most of his career. His self-published 1983 book The Visual Display of Quantitative Information is the canonical reference on the design of statistical graphics. It introduced the concepts of chartjunk, the data-ink ratio, and the lie factor, and gave the community its working vocabulary for distinguishing graphics that reveal data from graphics that decorate it.
The 1990 sequel Envisioning Information extended the argument to maps, train schedules and small multiples; Visual Explanations (1997) added cause-and-effect graphics and the famous case study of the Challenger O-ring failure as a failure of evidence presentation; and Beautiful Evidence (2006) introduced the sparkline. Tufte's books are themselves objects of design, typeset and printed to his own specifications, and his graphical principles are now embedded in the default styles of statistical software including R and ggplot2.
Related people: William Cleveland, Colin Ware
Works cited in this book:
Discussed in:
- Chapter 14: Data Visualisation (Tufte's Principles)
- Chapter 14: Data Visualisation (Chartjunk and the Data-Ink Ratio)
- Chapter 14: Data Visualisation (Sparklines and Small Multiples)